
Well, I’m going to show you how to overcome that fear of losing a profit by explaining the nature of price moves in the Forex market. We already know we don’t trade when news events are imminent. Just last week the Feds cut interest rates by ½ percent. It shocked the dollar, plunging it to an all time low against the Euro. But what about normal price swings during the trading day. An interesting phenomenon often occurs. Take a look at the next picture. Prices were swinging wildly after the 5:30 AM (Pacific) report time. Then around 7:30 the EMA’s crossed over, the red line now on top indicating a decline. We should only sell short this market. We could have caught a number of latitude lines. But, more importantly, we would have felt confident trading the next three downswings. Why? Because each one declined more than the previous! Chart 3 This sort of thing happens all the time. As we get into the trading day the swings become progressively wider. Then, as the day begins to finish up the swings contract until they’re often just a straight line. Perhaps I can best explain this by showing you a trade I made on a day I don’t usually trade. Monday, September 3rd 2007, arrives bright and sunny here in Seattle. It’s Labor Day but the world-wide Forex market is open for business. I’m up at around 5:30 AM to check things out. I don’t expect much activity since it’s a holiday here in America. But, I notice a nice trade shaping up on the 15 minute chart. It looks very similar to the charts we were looking at earlier. Notice how the moving averages are declining and have crossed over around 5 AM. The red line is now above the green line signaling we should only sell this market. Stochastics are also declining. Here’s what it looks like: Chart 4 Looking at point one (P1) we see that the high point for that swing is 1.36455. (I usually use just the last three digits to do my computations, i.e. 45.5). The low at point two (P2) is 1.36235 (23.5). If we subtract the low, 23.5, from the high, 45.5, we get 22.0. That’s how many “pips” this market has fallen. Why is this important to know? Because price movements have a tendency to repeat themselves over and over as they trend up and down. In fact they tend to “overshoot” the next move in a busy market (and undershoot in a quiet market). So, the next downswing should be at least 22 pips. (By the way, the previous downswing before P1 was 20 pips.) Point three (P3) at 1.36356 (35.6) I figured was going to be the next high (we’ll get into why I believed this later).

Analyzing The Trading Day - Part II
Tuesday 30 December 2008Analyzing The Trading Day - Part I
Monday 29 December 2008They begin a long roll where only the steel-nerved gamblers bet up the table. The weak are pulling back because they’ve been conditioned to losing. When the roll is finished, the winners have made up all their losses and then some. The losers have won a few dollars but go home broke.
It’s often the same way with the Forex markets. Small up-down moves that are pretty difficult to make any money with. Then large, sizeable moves that seem to come out of nowhere where you just can’t believe they keep going and going and going.
That’s why we have to analyze what type of trading day we are having. That’s when our charts give us an edge. That’s how we adapt our trading to the type of day we are having – a long roll, or a choppy one. If we can just do all that we can make our five percent and go home!
So, let’s get down to business. I’ve shown you how to make money trading the latitude lines. This type of trading is more in tune with a choppy market. Let’s see how this works again.
First, I’m going to show you what a choppy day looks like. Then I’ll show you what I call a long roll day. Lastly, I’m going to show you how to blend them together to suit your personality.
Take a look at the choppy day. Notice how many latitude lines are crossed up and down, but at the end of the day prices are just about where they started. How many lines would you have caught? I’ll bet more than enough to make five percent.
Chart 1

Chart 2

Look at the choppy day chart again. Later, we’ll look at all the tools we use to determine the direction prices might be moving. But in this chart notice the movement from the left hand side of the chart. Prices are rising, but stochastics are slowly moving down.
This is called a divergence and we should anticipate that a decline will follow. Sure enough, prices fell from 1.3885 down through six latitude lines! In a choppy market we have to be on our toes. We have to watch the screen almost constantly.
Now look at the “long roll” day. There are wide swings up, then sizeable swings down. If we can catch just one of those swings we could make our five percent in one trade.
But, here’s the problem. Most traders are afraid to hold a trade for that long. They’ve been told, “You can’t go broke takin’ a profit!” They simply can’t believe prices will keep going their way. They get out too soon when they should actually be adding to their position. As I said earlier, they turn around at San Francisco instead of flying on to LA.
Constructing Our Charts
In our condensed version we saw how we use three basic charts to trade with – a one minute, five minute and a fifteen minute chart. Each one serves a different purpose. But before we can use them we have to modify the parameters to fit the way each is used.
We’ll start with the 5 minute chart. When it’s first displayed, depending on your initial setup, it may be somewhat different than what we want. If you don’t see a 5 minute chart, click the icon above the platform chart on the right.
Once the chart is in front of you make sure you select EUR/USD. . 5 minute. . Candlestick at the top of the chart.
Next, we want to set up our exponential moving averages. There are two of them, a 30 bar, which means thirty 5 minute bars will be averaged (with the last few bars exponential weighted), and a 20 bar average which we will colour green.
Click on “Add Study” at the left bottom and select EMA. Again, at the bottom change the 14 to 20 and click the plus + sign next to it. Click your cursor on the line displayed and change the colour to green.
Do the same thing again only change the 14 to 30, and colour the line red.
Next, we want to set up the Stochastic index at the bottom of our chart. Stochastics, first introduced by a Czechoslovakian and made popular by publisher George C. Lane, they help us get a better picture of what is happening.
I modify it in an unusual way. When it’s used with a one minute chart it’s fairly accurate, but the turns tend to lag progressively more and more when used with a longer time frame, for example, 5, 15, 30, etc.
Still, it’s the only real indicator I use on a consistent basis.
Stochastics are based on the idea that as prices rise the closing price for that time frame (or bar) tends to settle close to the top of the highest price registered for that time frame. This happens because traders are stimulated to buy as prices move higher. The reverse is true in a decline.
Click the “Add Study” button again and select Slow Stochastics. Change the 14 to 8, leave the 3 as is and click on the +. You’ll see two lines appear at the bottom.
One will be sort of jerky and the other smoother. Without going into why, I use just the smooth line. I get rid of the other by clicking on it and colouring it black.
The line we’re hiding is much faster, but can give you a false sense of direction. If you want to tell what it is reading look at the number at the lower left part of the chart as you move your cursor over a bar. It will rise and fall accordingly.
Now we need to give it some framework to help us use it. Stochastics rarely move much higher than 80 or lower than 20. That’s why we put in two horizontal lines at 80 and 20. Click on the stochastic area and select “Horizontal Trendline.” Move it to the 80 level and click again. Do the same thing only place it at the 20 level.
Do the same thing again at mid-level, 50, and colour it green. That completes our stochastic indicator. You can expand or contract it by clicking and holding the top of the index frame.
Remember, we’re doing all these adjustments just to the 5 minute chart. We’ll create the 1 and 15 minute charts by copying the 5 minute chart. Once we’re finished we’ll save all of them by clicking on Tools=>Save Current Layout.
I covered how to create the “Latitude Lines” earlier, but they’re just like creating the stochastic lines. I colour them blue and “Duplicate” them at the selected levels.
Now we can duplicate our 1 and 15 minute charts. Simply click the icon on the 5 minute chart and change the time frame at the top of the new chart to 1 minute. Do the same thing to create a 15 minute chart.
I usually put the 1 minute chart on full screen. I then grab the edges of the 5 and 15 minute charts to contract them so they’re on top of the 1 minute chart .
I’m sure you’re beginning to wonder if we’re ever going to get to the trading business But I can assure you all of this is necessary. Keep in mind a fair amount of work goes in to producing any kind of profit. Is it worth it?
How long would you have to work to earn $500? A day? Two days? A week? I'm a great believer in the concept that we're paid for what we're worth.
If we're out of work we're worth nothing! If we're a CEO we might be earning $500 an hour. So the effort we put in to earn $500 or more is equal to the time we spend doing the work to produce these results. I don't know how to put it any other way.
But, guess what? We’re all through with the paperwork and ready to start trading.
The Basics
Tuesday 23 December 2008Earlier I mentioned that currency trading is simple. That’s true. But you can make it as complex as you want it to be. What I’m saying is, do you want to learn everything there is to know about the Forex markets, or do you just want to make some money?
If the latter is the case then you’re in for a surprise. I’ve said before I honestly don’t know that much about the markets myself, so that makes my job simple.
I just have to teach you how to make money!
However, if you insist, I can tell you the best book on the market to learn all about this business is “Day Trading The Currency Market,” by Kathy Lien. You can get it at www.amazon.com for under fifty bucks.
Now, let me start by explaining how all this works. We are basically buying and selling a line on a chart, just like we would buy and sell a house. It’s no different.
We’re hoping our line will give us a profit, the same way we’re hoping our house will increase in value. The only difference is the time frame. A few minutes with Forex – a few years with a home.
We start out with a small position until we’ve made some money. If the trade begins to fail we dump it with a small loss – something more difficult to do if we’re buying and selling houses.
If our trade is successful we stick with it. We may even add to it. But basically we just want to make a series of small profits until we reach five percent for the day.
We’ve seen earlier how we can make a profit just by buying or selling the “Latitude Lines.” It’s somewhat easy to do if we have everything set up properly and wait for the market to come to us. But this means watching our screen almost minute-by-minute for that moment to arrive. I have a better way of doing it.
But first, I want to show you exactly how to open an account, fund the account, and set up your screen. I didn’t go into that much detail in the condensed version so that’s what I’m going to show you now.
First, go to http://www.fxtrade.oanda.com. There are a number of links you can click, but scroll down the left side to “About OandA.” This will give you a pretty good picture of what OandA is all about.
Once you’ve reviewed the firm’s history go to their site which compares the spreads of all their competitors: www.fxtrade.oanda.com/spreads/comparing_broker_spreads.shtml.
Understanding spreads is important because the spread represents the up-front cost of trading. Unlike stocks, there are no commissions in the Forex market. Forex market makers, like OandA, generate most of their revenue from these spreads.
Now go back to http://www.fxtrade.oanda.com and on the left side again click on “Open New Account,” under either the FXTrade Accounts, or FXGame Practice Accounts. The choice, of course, is up to you. But, since you’ve come this far and are probably serious about making money, I would suggest opening an actual account. Why?
I can tell you from experience you’re going to learn faster with a real account simply because you’re going to pay more attention to a real account! Plus, if you’re successful with a demo account you’ll end up getting the real thing anyway.
Don’t forget, you can start with as little as you wish! OandA even says $1 but I would give yourself a little more wiggle room. Perhaps $100 to $500 dollars. As I said earlier, “Your training starts with your first deposit.”
Finally, check out all the links to interest payments of which OandA is the leader of its competitors: http://fxtrade.oanda.com/fxtrade/interest_payment.shtml
Okay, let’s open an account: http://fxtrade.oanda.com/fxtrade/open_account.shtml
Everything is self-explanatory. Just follow the steps, 1-2-3. One question they will ask is what leverage (margin) you want to use. We’ll go into that later in detail but for now simply use the default setting of 20:1.
They will also ask you to verify your ID. I presume this is to discourage money laundering, but in any case it’s no big thing. Download the “id_confirmation.pdf” form and follow the instructions.
Later, you should also review and print out the “Platform User Guide” by going to
Home=> Support=> Platform User Guide.
Okay. It’s time to fund our account with some money. We click on “Deposit Funds” from the “account” tab and that brings up the “Deposit Funds, New Client” window. You must receive a confirmation email before you can continue.
Once this is received scroll down to “Existing Clients” and click on Log In To the Cash Management System. You must then log in to get started. Follow the instructions. They will ask you if you’ve sent funds. Click “no” and select your method of payment.
You may want to review all three methods, bank wire, check or PayPal, which is the easiest. They will credit your account within one working day, but if they’re not too busy it can be as little as one hour.
If you don’t have a PayPal account you can click on the “Open your PayPal account” button and follow the instructions.
OandA charges you 2.9% plus 30 cents ($0.30) to process your deposit from PayPal. On a hundred dollars that’s $3.20 . . well worth it. Let me remind you I make nothing for referring you to OandA. My goal is to see you succeed and opening an account with OandA is just one of the many elements to your success.
If you use PayPal there are a couple of things you should be aware of. First, your name and email address must be the same as your OandA account. Second, when you prepare your PayPal transfer be sure to click on “Add special instructions for the Merchant” and type in your username and account number so they’ll know who’s sending them money.
Now, let’s set up our trading platform. This will vary with each broker, but basically we’re trying to organize the business end of our trading, which has little to do with the actual selection of our trade.
The Starting Bell
Friday 19 December 2008I’d like to start things out by explaining why I believe the Forex markets are far superior for trading purposes than nearly any other market – even the stock market.
First of all, there is no commission or exchange fees. That sounds great. Perhaps you’re thinking this means you’ll make more money all things being equal.
What this really means is you’ll save more money because psychologically you’re not afraid to get out of a losing position simply because you’ll have to pay a fat commission.
Second, there are no restrictions on selling short as there is on stock exchanges. Since currency trading always involves buying one currency and selling another, there is really no bias or emotional element to selling short.
If you are not familiar with selling stocks short, it’s borrowing the shares of a company, selling them on the open market and then buying them back at a lower price (hopefully) to replace the borrowed shares.
Third, the leverage on your money is exceptional. You can control many thousands of dollars of currencies with just a few hundred. Of course this can work against you as well. That’s why I believe you should start small until you gain the knowledge and experience to trade larger amounts.
Fourth, while you can lose all your money, you can never lose more than what you have in your account. Also, unlike stocks, the price you pick for a stop loss in the Forex market is the price you’re going to get.
Lastly, Forex prices are somewhat adaptable to technical trading (the use of so-called indicators) as compared to fundamental and economic news. We’re going to get into that a great deal more in the rest of this manual.
For now I just want you to concentrate on two things: Risk control and Discipline!
Forex trading is really very simple to learn. On the other hand, discipline is far more difficult. I don’t think you can be taught discipline. You just have to learn it in whatever way your personality dictates. And one of the best ways to learn discipline is to lose a chunk of money.
I don’t want that to happen to you, but when it does, profit from it. What did I do that I could have avoided? What was I thinking of when I put on that trade? Did I jump in too soon? Was I too aggressive? Did I overtrade? Was I trying to get back money I just lost? Things like that.
I’m going to help you as best I can to control the emotional part of trading. But I can only do so much. You’ll have to carry the ball the rest of the way.
Remember, our goal is to simply make five percent a day. We’ve seen what we can achieve if we can do that. Don’t lose sight of your goal. Be a winner!
I have this recurrent dream. I learned it from Richard Dennis, a legendary and perhaps the greatest commodity futures trader in the world. Starting with just $400 he traded it up to several hundred million.
Dennis believed he could take a group of newbies – Turtles, he called them – and train them to do what he did. The rest was history. They went on to do just that!
It’s my dream of turning hundreds of Turtles all over the world into millionaires. I hope you’ll keep that in mind as you continue to read.
A Trading Day
Thursday 18 December 2008I usually start my trading day around 5:00 AM. I don’t actually trade before the 5:30 (Pacific) reports come out, but I spend the time looking at the 15 minute – and often the 30 and 60 minute time frames – to get a feel for what was going on overnight.
Often a report will set the tone for the trading day. Is the dollar being hurt by bond sales bad economic data, political news? Things like that. You’ll often see a sustained move, up or down, for the whole day. Those days are easy to trade.
I generally start out using a smaller amount of cash. Somewhere around one-half to one percent loss instead of two percent. Then as the day progresses, and I’m ahead, I bump it up to normal until I’m getting close to my five percent goal. Then I cut back again so I don’t lose a bundle just before I quit for the day.
I rarely, if ever, use a market order (an order that’s filled at whatever price the market is trading at). I know where I want to get in and get out at all times. Using a market order doesn’t guarantee the price you want.
The trades that are most successful for me are those that are placed using a buy stop or sell stop. That’s where the price is above or below the latitude line I want to trade off, and then moves in the direction I expect. That way the movement already has momentum behind it and usually keeps going.
For example, let’s say everything is “in-sync” for prices to move higher. I don’t care about buying at the bottom of the swing. I want to see prices rising and then place my order to catch the trade – often doing so in the last phase of the upswing.
Let me give you an actual example. A trade is shaping up right now as I’m typing. (So many trades, so little time!) EUR/USD has been in a sustained downswing all afternoon as shown on the 15 min. chart on the left. Around 2 PM it bounces up.
Shortly after, stochastics on the 5 min. chart begin to roll over as shown down.
Chat 1
At the same time notice how the EMA’s have been declining all afternoon and the red line (the EMA 30) has stayed on top of the green line, confirming the decline.
Now, as the 5 min. candlestick “kisses” the EMA’s I place an order to sell 20,000 units at latitude line 1.3455. Notice I didn’t say, “Sell right now!” I only want to sell if it declines to 1.3455. I want it moving my way! You can see what happened. I’m in and then I’m out. It’s nearly identical to my pizza trade!

I probably make it look easy. But really, it’s not that hard if you just follow the rules and take it nice and easy. You can’t trade like a zombie, 24 hours a day, like some folks do at a casino. You don’t need to. You just need five percent a day!
Now, let me cover something you need to know. If you recall I try to place my orders so I don’t lose more than two percent of my capital on any one trade. If we’re trading with about five hundred dollars that’s $10.
Whoops! Time out. Here comes another trade. I can’t keep up with ‘em all! Same thing as my last trade an hour or so ago. Can you see how easy it is when you let the market come to you instead of chasing prices yourself?
Chart 2

Let’s get back to losing 2%. Initially, when I first place my order, I select my stop loss (the point at which I want to abandon the trade) ten pips away. On 20,000 units that’s a loss of $20. I do this for two reasons.
First, when my trade is executed the spread price of 1.2 pips is “activated.” Instead of starting the trade at 1.34550, it actually starts at 1.34562. If I placed my stop at 1.34600 that’s only 3.8 pips away. In an active market that’s too close. I might get stopped out needlessly.
Second, You must have a stop loss in place when the trade is executed -- for one important reason. What if your computer restarts, crashes, or you lose the internet connection? Without a protective stop you’re going to be hurt badly if prices suddenly move in the wrong direction before you can get back online.
However, once the trade is in place I start moving the stop to within 5 pips from the current price and continue moving it if prices keep going in my direction until my profit point closes the trade.
That’s how you stay out of trouble. That’s how you avoid a “bad” day!
One last thing. Be sure to select User Preferences under “Tools” and change the default “Stop Loss” and “Take Profit” boxes appropriately.
Well, that’s it. Does all this make sense. Like I said at the beginning.
“Is it really possible to earn $500 Dollars a day!” I can assure you it really is!
Organizing our Trade
Wednesday 17 December 2008That’s what we’re going to risk on our next trade. That’s what we must base our trade on. A loss of $10. We’ll come back to this in a minute.
My strategy is based on crossing horizontal lines I call “latitude Lines.”
As a pilot, if I’m flying from Seattle to Los Angeles I’m going to cross several latitude lines as I fly South, i.e. down.
I’m not going to turn around at San Francisco, because that’s not my destination. I’m going to keep flying until I reach Los Angeles.
If I’m flying from Miami to New Jersey I’m not going to turn around at Charleston, South Carolina. I’m going to keep going North! You get the picture.
And that’s the way it is with trading. Many potentially good traders are always thinking to take a profit too soon – before they reach their final destination.
What we’re going to show you is how to reach your destination by using a roadmap of prices on a chart!
What do prices look like when they’re moving up and down? There are several kinds of charts, the most popular being the bar chart. The top of the bar is the high for the day, the bottom the low.
On the right side a small tick is made indicating the close. Sometimes a tick is made on the left side indicating the open price.
Another type of chart gaining popularity – and the one I use – is the "candlestick" chart. The body of the price shows the open and closing price. If the body is black it means the close was lower than the open. On our Forex chart the body is red instead of black ifprices are falling.
The body is blue if the close was higher than the open. The so called shadow or "wick" at the top and bottom indicates the high and low for the period.
Let’s compare the two types. This is a bar chart:
Chart 1
The same chart as above in candlestick form looks like this:
Chart 2
We use a combination of three charts. A 15 minute, (each bar is 15 minutes in duration) a 5 minute and a one minute chart.
We use the 5 minute chart to trade with, the 15 minute chart to help us determine the trend, and the one minute chart to help us enter the trade at the right time.
First, however, we have to set up our so called “Platform”. It looks like this. Click on all the buttons to get a feel of how everything works. This is where we pick and choose to place, change or delete our trades.
Chart 3
For example, if you click on the tab marked “Activity” you’ll be able to see all the activity that has happened in your account in the past. It includes all interest payments, orders, fills, etc. You can also choose what you want it to display by clicking on the small icon on the right after selecting “Activity.”
The tab marked “Orders” displays the orders you have placed. The “Trades” tab shows the open positions that are in play.
The Quote Panel tells us the spread between prices (It’s showing ten because it’s a weekend). During trading hours it usually shows 1.2, one of the lowest spreads in the industry. If things get volatile, like a wild report, it expands. Sometimes to 15!
We want to avoid trading during that time. Our stops will be too far away.
Now, let’s discuss each of our charts in turn starting with the five minute chart.
To create a new chart we click on the icon just above and to the right of any chart displayed, including our platform. It looks like this:
We can then begin to set up our chart with the tools we use to make our trade. For example, we select a time frame of 5 min . . EUR/USD . . CandleStick.
Chart 4
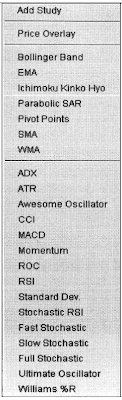
Notice the wavy line at the bottom. This is an indicator I use to help me determine where prices might be headed. It’s called stochastics. It’s generated by clicking the box at the bottom left labeled “add study.” This brings up a variety of indicators you can use to help guide you as you trade. Displayed on the right side they look like this:
Over the years I’ve checked out nearly all of them and found while most are helpful most of the time, you can’t depend on the majority of them. I use only a few.
For example, moving averages are somewhat dependable in determining the current direction of prices. There are two types, exponential and simple. At best they keep me from putting on a trade in the wrong direction.
At their poorest, they lag in showing a change of direction quickly enough for a trade. In a minute I’ll show you how I use them. And, by the way, I alter all the parameters of any indicator I use.
Now we have to draw some horizontal lines on the stochastic indicator at the bottom of the chart.
To do that, move your cursor down to the stochastics area and left click the chart. Select “Horizontal trend line.” It will be yellow. Then move the line to around the 80.00 level. Do the same thing again at the 20.00 level. It doesn’t have to be exact.
Do the same thing again only this time select the 50.00 level and change the line to green. You do this by clicking on the line and selecting a colour.
The area above the green line is generally where you would be looking to sell rather than buy. Below the green line is the buying area.
You see, one indicator alone is not the “yellow brick road” to riches. If it were there would be no markets. That’s why we use several indicators – including the price action itself – to make a “best guess” scenario for ourselves. After that it’s how we handle the gain or loss that will determine our success.
Next, we’re going to create two exponential moving averages by clicking on “Add Study,” then EMA. You’ll see EMA . . 14. Change the 14 to 20, click on the + sign and then change the line’s colour by clicking on the line and selecting green.
Do the same thing again, but this time change the 14 to 30 and colour the line red. What we’re doing here is creating a longer term line based on 30 bars that is red. Take a look at this screen. Notice the moving average lines are generally moving higher.
Chart 5
But, more important, the red line is below the green line. As long as this continues we would expect prices to move higher. Here is a blow-up of the chart.

During the early morning we would only BUY this pattern. Note how many opportunities we have to buy the latitude lines. Then, around 7:00 AM a report comes out. The spread widens to ten and after some backing and filling prices begin to drop. Notice how they are unable to better the seven o’clock high? That’s what we mean when we talk about watching the price action. Shortly after the EMA’s cross one another.
Which brings up the next tool we use – connecting the highs and lows of prices. This is sometimes a little hard to judge, but basically we left click on the chart, select “Draw Trendline” and move the cursor to a high or low and click again. Then drag the line to the next high or low.
After a few practice tries it will become easier. These lines are important because they show us if we are getting higher highs or lower lows. We always want to be trading in the direction (the trend) of prices.
Another thing you’ll notice when drawing trendlines is that prices will usually retract or rally roughly half-way the distance from the previous move. This can be helpful when picking a latitude line to trade. Lastly, to finish setting up our chart, we need to create the latitude lines themselves. Although they look like they’re automatically drawn, they’re not. We have to do it ourselves. And there’s a reason for that.
Most of the time I construct them in five pip increments. But sometimes, when things become really wild, I’ll use a ten pip increment. When things become slow, I’ll often use just three pips between latitude lines.
To do this we left click on our chart, select “Horizontal Trendline,” and move the line to the price we want. Then click on the line and change the colour to blue. To draw another latitude line just click on any line and select “Duplicate.”
Once again, I apologize for being so redundant but I believe you must be consistent each time you trade. For example, I believe one of the biggest faults a good trader can have I thinking the money he has earned is “house money,” like cash won at a casino.
That money isn’t theirs anymore. It’s yours! You’ve got to protect it. And you do that with good old-fashioned discipline. For example, I have no trade going as the 7:00 AM report period approaches. Sure enough, it shocks the market.
Stochastics had already been in a decline and failed to better their 6:00 AM high. A comfortable divergence had occurred when prices rallied but stochastics did not. By the way today is Monday, June 25th. I’ve been writing this report for about two weeks now. Seems like only yesterday I showed you my pizza trade. This one reminded me of that. Now that you have an idea what this is all about you can understand the trade a little better.
I placed an order to sell at the 1.3460 line and buy at 1.3455. Here’s the trade:

You can also see the Moving Averages crossing over. The red line is now moving above the green, signaling a decline.
You’ll note we did not have any other trade going when prices fell from roughly 1.3465 to 1.3445, a drop of 20 pips. We don’t need to and we don’t much care. We’re only interested in that five percent per day (which in this case we’ve already earned).
Once we’ve set up our 5 minute chart we can click on the chart icon and duplicate the chart. Then change it to 15 minutes. Do it again and change it to one minute.
We now have three charts with different time frames that we can use to anticipate what latitude lines we will use and the direction we should follow. By moving the sides of each chart (the windows) we can look at all three as we trade, as it shows below.
Before I finish Organizing our Trade I want emphasize how important it is to have everything working for you – “in-sync” so to speak. Watch all three stochastic charts, moving average cross-overs, etc. Remember you only need 2-3 good, solid trades to meet your 5% goal.

Setting up Shop
Tuesday 16 December 2008Let’s log on to our trading website, http://oanda.com. There are many things to learn, but if you just want to start trading that’s what I’m about to show you. Most firms, including OandA, have two kinds of accounts. An actual trading account and a “demo” account that works the same way. If you’ve never traded before then I would suggest the demo account at first, then open a real account for maybe $100 until you become more experienced. That’s right, you can trade with as little as one dollar.
Once you’re on the home page scroll down to “About OandA” on the left side. After reading about the company, which is pretty impressive, go to their FAQ site a http://www.fxtrade.com/whyfxtrade.
Go back to the home page and select “Open New Account” under the FXTrade or the FXGame, which is their demo account. If you decide to open an actual account you need to fund it. The simplest way is with PayPal. If you don’t have a PayPal account go to http://www.paypal.com and click on “sign up.” and follow the instructions. You can use a credit card and/or a bank account to deposit funds. Then go back to OandA and log in. Go to “deposit Funds” and follow the instructions. It’s easy and it’s secure.
You must first submit a form, for security purposes, that tells them you are going to submit funds. Follow the instructions, but be sure to click on “Log in to cash management” to advise them you are sending funds. The rest is easy. You will have to pay a small fee to transfer funds. Don’t worry about it. You will soon make up this fee.
Are you ready to go? Because you’re about to enter the “big time.” It doesn’t matter if you’re just starting out with $100 or $100,000. You’re going to double your money if you follow the rules I’m going to outline.
Forex Money Management
Monday 10 November 2008Before we get into the actual tactics of trading the Forex markets we have to cover what
I consider the single most important element of trading: money management.
We can be the best trader in the business, but if we let our losses exceed our gains we’ll end up being a loser!
I often compare trading to gambling. If you’ve read my previous eBook, “$$500 Dollars per Trade,” you know what I’m talking about.
It’s called “gambler’s mentality.” If you gamble and make money you believe you can make more if you just keep betting more and more. Some gamblers even feel guilty about winning so much in such a short time – but that’s another story.
When you gamble at a casino the odds are pretty much even. Less than one percent at the dice table. That means you should lose only one dollar for every one hundred wagered.
So why is it 97% of the people go home broke? Do I have to answer that, or do you know the answer already.
It’s called greed.
And that’s what you must overcome if you are going to be a successful trader.
Here’s what happens if you’ve been making money and start to lose (which is inevitable). First, you lose control. You bet bigger and bigger as you lose. You toss aside whatever strategy was making money for you when you were winning. You start “chasing” your money.
Any idea of making a profit is abandoned. Your only thought is getting back even.
Until, of course, it’s time to go home.
And that’s what this chapter and the Forex markets are all about. You’re already home and the markets are still open. Forex is a 24 hour casino, right on your PC! And, unlike internet gambling, it’s legal.
Nevertheless you must accept the fact there are millions of traders out there – like a vast casino – that all have the same idea, “Make a bundle of money, and go home.”
Well, we’re going to rise above that “herd mentality.” Just like a cattle stampede you’ve seen in the movies. Do you want to be a part of that?
I didn’t think so.
So, here’s how we handle our money, plain and simple.
Let’s go back to my pizza trade. I made $10 using about five hundred dollars. Let’s see. . that’s two percent on my money ($10 divided by 500 . . duh!).
But what if I had lost $10 dollars? That’s two percent also. Would you agree that’s a reasonable amount to wager to make two percent? So, if we can just keep our losses at two percent we can maintain control of our money.
But now let’s say we actually had $1,000 dollars in our account. Our profit and loss would be just one percent. Are you starting to get the picture? We don’t have to “bet the farm” to make two percent. We just have to do the math!
And the Forex markets allow us to do that. We know exactly where to get in and where to get out to make or lose two percent. And many times we’ll lose much less than two percent – often just breaking even – which is fine with us.
Remember, our original goal is to make five percent per day. And that brings us to the hard part. What do we do when we’ve made five percent?
We quit for the day. “But why quit when we’re making money?” you might ask.
Let me ask you a simple question. What are you going to do if your very next trade is a loser? Are you going to quit then? Once again: I don’t think so!
Now can you see what I’m getting at. Our overall goal is to double our money every fifteen days. So, maybe it takes eighteen or nineteen because we had some bad days.
What’s a “bad” day? It’s when we lose ten percent of our money. That’s $50 on five hundred. Once again we quit for the day if our losses total ten percent of what we started the day with.
Some traders will argue that’s excessive. But, as we’ll see, our strategy is so strong that it’s rare to have a “bad” day.
And the next day we start out like nothing happened. We have a fresh mind and attitude and pretty much know our strategy will overcome our losses.
We’re not trying to “get our money back.” We’re not beating ourselves up because we had a losing day. We’re in control!
Now, let’s recap all this.
1. We never risk more than 2% on any one trade.
2. We quit for the day if we’ve made five percent on our money.
3. We quit for the day if we’ve lost ten percent.
4. We also quit at 3:00 PM Eastern no matter where we are simply
because the markets slow down around that time.
If you start your trading day like I do at 8:30 AM Eastern (5:30 AM Pacific) – since I’m retired – I’m usually done within 2-3 hours. Often in less than an hour!
If you have a day job you might trade after dinner instead of watching TV. Of course when and if you make a go of this business you can quit your day job!
Now, here’s a couple tips to help you maintain your discipline.
First, to keep you from going back to the trading table after you’ve quit, try using this website: http://www.webjillion.com/index.php It’s called Temptation Blocker, and once it’s activated it won’t let you go back to any program you’ve selected for whatever time you input. (You can override it but it takes an effort.)
Finding a Forex Broker
First things first. We need a broker to handle our transactions. This is a little dicey for me because I use a broker I consider the best: OandA. Not all broker/dealers are reputable. There are scoundrels at all levels. Since this is a world-wide business it pays to check out who you’re dealing with. I selected http://www.oanda.com on that basis and am very happy I did so. However, not everyone agrees with me.
It’s my own opinion and experience. And I don’t receive a dime for referring you to them. You may already have a broker of your own, but if not then give them a try. For one thing all the info you’re going to learn and see in this report is from their platform.
On the other hand, if you’d like to check out additional brokers, there’s a pretty good collection of opinions at: http://www.forexpeacearmy.com
Here’s a review from that site that expresses my sentiments completely.
From: Nick in Brisbane
Date of Post: 2008-10-27
Review: “I've been using OandA for almost 2 years and haven’t experienced any major issues with their service or platform. Their charting software is not the best but the most important things for me are tight spreads on the majors and reliable execution of orders.
The bitching that goes on here about wide spreads during data releases just confirms my opinion that most would-be traders here are novices with very limited experience or knowledge of themechanics of financial market places. During volatile market conditions all brokers have to face and deal with widening spreads from their liquidity providers. That’s the nature of the global nterbank market. For some reason all the "Johnny come lately" trade-from-home novices that frequent this site think that for some reason brokers such as OandA should bear the cost of this volatility by guaranteeing fixed spreads.
Trading currencies intra day is not a get rich scheme but a highly skilled niche skill. If you can’t devise a way to make money without betting on split second volatility during data releases then go and find something else to do.”
What he’s saying is there is widespread trading based on news events. For example, if you think an interest related report is coming out that is gong to move the markets, you jump on it.
But let’s be honest. Do you think you can catch that kind of trade consistently when your
competition is big banks with millions of dollars?
I don’t trade news stories. Never have. It’s just not worth the grief if you’re on the wrong side. So I would strongly encourage you to refrain from that kind of trading unless you have a really good crystal ball! Now that we’ve got that out of the way, let me be more specific. I only trade the Eurodollar/US Dollar (EUR/USD) pair, but my strategy works with any currency pair.
If one currency gets stronger than the other then the numbers go up (or down). To tell you the truth I don’t really understand why. The less I know about economics the less likely I am to be influenced one way or the other!
I just know how to trade the numbers!
Now, this is very important. On most days, at precisely 08:30 AM, Eastern time, and then again at 10:00 AM Eastern, a variety of reports come out that can shock the markets. We do not want to hold a position around these times!
Once again, for the few moments before and after these times, do not trade. When the
fireworks are over we go back to our regular trading pattern.
We make our profits on small, consistent trades that add up to five percent per day. We don’t shoot for a big killing that could result in devastating losses!
If we don’t reach our goal of five percent, possibly because of a very slow day, we don’t try to make up for it. We simply wait for tomorrow to continue our efforts.
We’re not in a hurry. We’re not greedy. We know we’re going to the world series even though we’re going to lose a lot of games on the way!
Before I finish beating this issue to death, there is one more thing you must take into account and that is the meeting convened usually eight times a year by the Federal Open Market Committee (FOMC). This is the group (commonly called the Fed’s Fund Rating) that defines interest rates.
This has a huge impact on the currency markets. DO NOT try to trade during the few minutes before and after the report is made public, around 2:15 PM. Eastern.
To obtain the dates, go to:
http://www.federalreserve.gov/monetarypolicy/fomc.htm#calendars
End of issue!
Forex Background
We’re going to start by debunking a bunch of myths.
First off, you don’t have to understand a lot about the currency markets. Most of us know there is a difference in the exchange rate if we take a trip to Canada, or Mexico, or Japan.
If you were to go to Japan right now, a dollar would buy about 120 Yen. You go to a kiosk or money changer, perhaps at the airport, and purchase whatever amount you think you’ll need. That’s easy enough.
But what if you’re a large bank doing business overseas. Your client has just purchased 1,000 new Toyota’s and they need to be paid for with Yen. That’s not so easy. That’s why the Forex markets exist.
Now for some facts. The market is huge. More money changes hands each day than nearly all the stock exchanges combined. That’s not that important to us as traders because we can trade with as little as $100.
There’s no commission charged, as there is at a stock exchange. That’s good. We don’t have to worry about paying extra if we get stopped out of our trade. (I’ll explain laterwhat that means if you’re not an experienced trader.)
Instead of a commission, a small spread between prices is leveled just like when you change money at the airport. For example, my pizza trade entry price was actually 1.33562. I had to make slightly more than $10 dollars to net ten.
The most important thing I want to impress upon you at this time is risk control.
You’re going to make money. But you’re also going to lose. How much you lose will determine your net profit. Always keep that concept in mind. You must control your losses if you expect to make the kind of money we discussed earlier.
Lastly, this is a “hands-on” trading manual. I’m going to train you to make money the same way I trained many pilots to fly jetliners.
That’s right. For many years, as an airline captain/instructor, trained by Boeing, I taught other airline pilots how to fly jetliners.
So what’s that got to do with trading? Just this.
When it comes to flying airplanes, you want to do it in the safest way possible. And the same thing is true when trading! You want to do it in the safest way possible.
Much of the material will be very specific. Much of it will be repetitious. But that’s how you learn. Don’t try to outguess the strategy. Everything you’ll learn has a purpose.
Keep an open mind and you’ll do just fine.
You don’t have to be smart. You don’t have to have a degree in rocket science.
You just have to follow the rules and procedures. Just like flying a jetliner!
Introdution to Forex
Sunday 9 November 2008You’re about to partake on a journey like nothing you have ever experienced. By the time you’ve reached the half-way point of this book you’re going to say something like, “Maybe it really is possible to earn $500 Dollars a day!”
Let me introduce myself. I’m G.C. Smith. Perhaps you know me from my previous eBook, “$$500 Dollars per Trade.”
Maybe I’ve met you at seminars we’ve attended. Or maybe we’ve exchanged e-mails in the past.
Whatever the case, you’re going to enjoy the trip I’m going to take you on as we learn all about how to trade the Foreign Exchange Markets – Forex for short. It’s now 5:30 PM, Pacific Daylight Time on Sunday, November 9th 2008. I’m getting ready to watch 60 minutes on TV.
But first, I just happened to see an easy trade shaping up on my PC. I see so many of them it sometimes makes me frustrated. It’s like the patrolman watching speeders go by:“I can’t catch ‘em all!”
But tonight I bought a $10 dollar pizza from Papa Murphy’s. If I can trade the Eurodollar against the US Dollar from 1.3355 to 1.3350 I’ll make ten bucks.
Using the tactics you’re going to learn in this report I did just that. It took nine minutes. And this isn’t even my normal trading day – Monday through Friday.
Okay, maybe I’m showing off. But, now that I’ve got your attention, let’s look at my trade a little closer. Because this trade represents what could be your goal to make $500 Dollars a day – or one million Dollars by next year.
There’s no reason you can’t, as long as you follow the rules I’m going to outline and maintain the discipline it’s going to require.
Let’s take a look at the chart of the trade. Each bar is equal to five minutes. We’ll explain more about all this later. Note how prices are swinging back and forth? We want that. If they remained flat, no one would make (or lose) anything.
And, they were trending down! We sold 20,000 units (equal to $2 Dollars) using about $500 trading dollars. We entered the trade at 1.3355 and closed it at 1.3350. That’s equal to five, so-called, “Pips.” Five pips times $2 is ten Dollars.
Again, don’t worry right now about all the fancy words. I don’t know an awful lot more than you about what all this means – and I could really care less.
But I do know how to trade. And that’s what I’m going to teach you.
So, hold on to your hat, and bear with me as I try to describe what could be a turning point in your life.
Let’s start by crunching some numbers. How long do you think it would take to double our money if we made five percent a day? That’s right. Five percent a day!
Before I answer that let’s go back to my pizza trade. I made $10 using about $500 Dollars. If we were to make five percent on $500 Dollars it would be $25 Dollars (500 times .05). With just one trade we’re almost half-way there!
If we earn five percent a day it will take fifteen trading days to double our money. Hard to believe, but true.
Take a look at this table.
DAY START 5% END TOTAL
1 500 25 525 25
2 525 26 551 51
3 551 27 578 78
4 578 28 606 106
5 606 30 636 136
6 636 31 667 167
7 667 33 700 200
8 700 35 735 235
9 735 36 771 271
10 771 38 809 309
11 809 40 849 349
12 849 42 891 391
13 891 44 935 435
14 935 46 981 481
15 981 49 1030 530
Pretty impressive wouldn’t you say? If we could just double our money every fifteen days, the sky’s the limit!
In fact, let’s see what it would look like.
1st fifteen days: $500 goes to $1,000
2nd fifteen days: $1,000 goes to $2,000
3rd fifteen days: $2,000 goes to $4,000
4th fifteen days: $4,000 goes to $8,000
5th fifteen days: $8,000 goes to $16,000
In just a little less than three months we could be earning five percent on $10,000 Dollars – $500 per day!
Want to carry this a little farther? $16,000 goes to $32,000. $32,000 goes to $64,000. $64,000 goes to $128,000. $128,00 goes to $256,000. $256,000 goes to $512,000. And $512,000 goes to One Million, Twenty-four Thousand Dollars.
Is this really possible? Yes! Is it realistic? Maybe! But, not without a great deal of training and discipline.
For example. Right now, would you take $10,000 Dollars and try to double it? I doubt it. It’s too scary.
How about $500 Dollars? “Yeah, I could probably afford to risk that much,” you might say. Whatever amount you start with, that’s when your training begins. And, as you became more and more experienced, you can begin to trade larger amounts with more confidence.
That’s the concept I’m going to teach you.
How to handle ten thousand dollars as if it’s $500.

